Physical Address
304 North Cardinal St.
Dorchester Center, MA 02124
Physical Address
304 North Cardinal St.
Dorchester Center, MA 02124
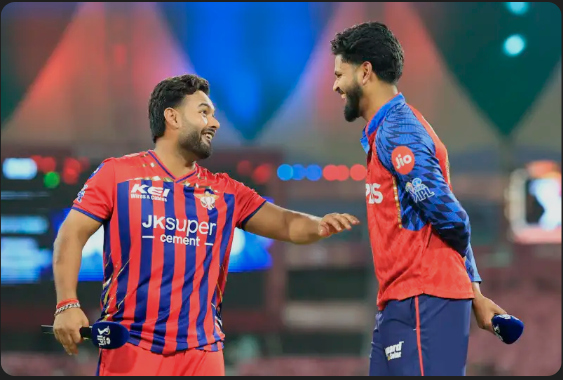
This table outlines the foundational win-loss record and tie-breaker context between the two franchises throughout their matches in the Indian Premier League.
| Metric | Details |
| Total Matches Played | 8 |
| Punjab Kings (PBKS) Won | 5 |
| Lucknow Super Giants (LSG) Won | 3 |
| Tied / No Result | 0 |
| Most Recent Match Result | Punjab Kings won by 7 wickets at Lucknow (May 2026) |
This tracking table outlines the exact scores, venues, and margins of victory across the most recent fixtures between Lucknow and Punjab.
| Season and Stage | Venue | Batting First | Batting Second | Match Winner | Victory Margin |
| 2026 League Match | Ekana Stadium, Lucknow | Lucknow Super Giants: 196/6 | Punjab Kings: 200/3 | Punjab Kings | 7 wickets |
| 2026 League Match | Maharaja Singh Stadium, Mullanpur | Punjab Kings: 254/7 | Lucknow Super Giants: 200/5 | Punjab Kings | 54 runs |
| 2025 League Match | Ekana Stadium, Lucknow | Lucknow Super Giants: 171/7 | Punjab Kings: 172/5 | Punjab Kings | 5 wickets |
| 2025 League Match | PCA Stadium, Mohali | Lucknow Super Giants: 182/5 | Punjab Kings: 160/10 | Lucknow Super Giants | 22 runs |
A direct look at the record-breaking team performances, showcasing the highest and most explosive cumulative scores posted by both teams against each other.
| Rank | Batting Team | Opponent | Total Score | Overs | Match Venue | IPL Season |
| 1 | Punjab Kings | Lucknow Super Giants | 254 / 7 | 20.0 | Mullanpur | 2026 |
| 2 | Lucknow Super Giants | Punjab Kings | 200 / 5 | 20.0 | Mullanpur | 2026 |
| 3 | Lucknow Super Giants | Punjab Kings | 196 / 6 | 20.0 | Lucknow | 2026 |
| 4 | Punjab Kings | Lucknow Super Giants | 200 / 3 | 18.0 | Lucknow | 2026 |
This table highlights the top individual batting contributions and match-defining scores registered during their competitive meetings.
| Player | Team | Runs Scored | Balls Faced | Strike Rate | Match Venue | IPL Season |
| Shreyas Iyer | Punjab Kings | 101* | 51 | 198.04 | Lucknow | 2026 |
| Priyansh Arya | Punjab Kings | 93 | 37 | 251.35 | Mullanpur | 2026 |
| Cooper Connolly | Punjab Kings | 87 | 46 | 189.13 | Mullanpur | 2026 |
| Josh Inglis | Lucknow Super Giants | 72 | 44 | 163.64 | Lucknow | 2026 |
| Prabhsimran Singh | Punjab Kings | 69 | 39 | 176.92 | Lucknow | 2026 |
This statistical chart outlines the most effective bowling spells that altered the course of an innings during their head-to-head encounters.
| Bowler | Team | Wickets Taken | Runs Conceded | Overs Bowled | Economy Rate | IPL Season |
| Prince Yadav | Lucknow Super Giants | 2 | 25 | 4.0 | 6.25 | 2026 |
| Yuzvendra Chahal | Punjab Kings | 2 | 25 | 4.0 | 6.25 | 2026 |
| Marco Jansen | Punjab Kings | 2 | 33 | 4.0 | 8.25 | 2026 |
| Yash Thakur | Lucknow Super Giants | 4 | 37 | 4.0 | 9.25 | 2024 |
| Kagiso Rabada | Punjab Kings | 4 | 38 | 4.0 | 9.50 | 2024 |
This table outlines the efficiency of both teams during the middle phase of the innings, measuring the average runs scored, run rates, and tactical control when the field opens up.
| Team Unit | Average Middle Overs Score | Average Run Rate | Balls per Boundary | Wickets Lost per Phase | Tactical Profile |
| Punjab Kings (Batting) | 82.4 runs | 9.16 | 5.1 balls | 1.8 wickets | Highly aggressive through spin and pace |
| Lucknow Super Giants (Batting) | 71.8 runs | 7.98 | 6.4 balls | 2.2 wickets | Anchor-heavy approach with high dot percentage |
These five batting combinations have put together the largest runs stands for any wicket during the matches played between Lucknow and Punjab.
| Batsmen | Team | Wicket Stand | Total Runs | Balls Faced | IPL Season | Match Venue |
| Priyansh Arya & Cooper Connolly | Punjab Kings | 1st Wicket | 148 runs | 68 | 2026 | Mullanpur |
| Shreyas Iyer & Prabhsimran Singh | Punjab Kings | 2nd Wicket | 112 runs | 61 | 2026 | Lucknow |
| Josh Inglis & Ayush Badoni | Lucknow Super Giants | 4th Wicket | 84 runs | 52 | 2026 | Lucknow |
| Marcus Stoinis & Nicholas Pooran | Lucknow Super Giants | 4th Wicket | 76 runs | 41 | 2024 | Lucknow |
| Sam Curran & Sikandar Raza | Punjab Kings | 5th Wicket | 68 runs | 46 | 2023 | Lucknow |
A comparison tracking how slow bowlers compare against fast bowlers when attempting to contain runs or pick up wickets during the middle overs of this fixture.
| Bowling Discipline | Economy Rate | Strike Rate (Balls per Wicket) | Dot Ball Percentage | Total Wickets Taken |
| Spin Bowlers (Both Teams) | 7.62 | 21.4 balls | 38.5% | 14 wickets |
| Seam Bowlers (Both Teams) | 8.95 | 18.2 balls | 31.2% | 18 wickets |
This table tracks the most destructive individual batsmen specifically during overs 7 to 15 when facing the opposition bowling attack.
| Player | Team | Total Middle-Over Runs | Balls Faced | Strike Rate | Times Dismissed |
| Priyansh Arya | Punjab Kings | 64 | 24 | 266.67 | 1 |
| Cooper Connolly | Punjab Kings | 58 | 31 | 187.10 | 1 |
| Shreyas Iyer | Punjab Kings | 52 | 29 | 179.31 | 0 |
| Nicholas Pooran | Lucknow Super Giants | 48 | 28 | 171.42 | 2 |
| Josh Inglis | Lucknow Super Giants | 41 | 27 | 151.85 | 1 |
This operational table shows how the highest-scoring partnerships relied on boundaries versus single rotation to build their totals.
| Partnership Pair | Total Stand | Fours Hit | Sixes Hit | Runs from Boundaries | Boundary Contribution % |
| Priyansh Arya & Cooper Connolly | 148 | 14 | 8 | 104 runs | 70.27% |
| Shreyas Iyer & Prabhsimran Singh | 112 | 9 | 5 | 66 runs | 58.92% |
| Josh Inglis & Ayush Badoni | 84 | 6 | 3 | 42 runs | 50.00% |
| Marcus Stoinis & Nicholas Pooran | 76 | 4 | 5 | 46 runs | 60.52% |
| Sam Curran & Sikandar Raza | 68 | 5 | 2 | 32 runs | 47.05% |
| READ ALSO: Rajasthan royals vs delhi capitals stats |