Physical Address
304 North Cardinal St.
Dorchester Center, MA 02124
Physical Address
304 North Cardinal St.
Dorchester Center, MA 02124
| Category | Details |
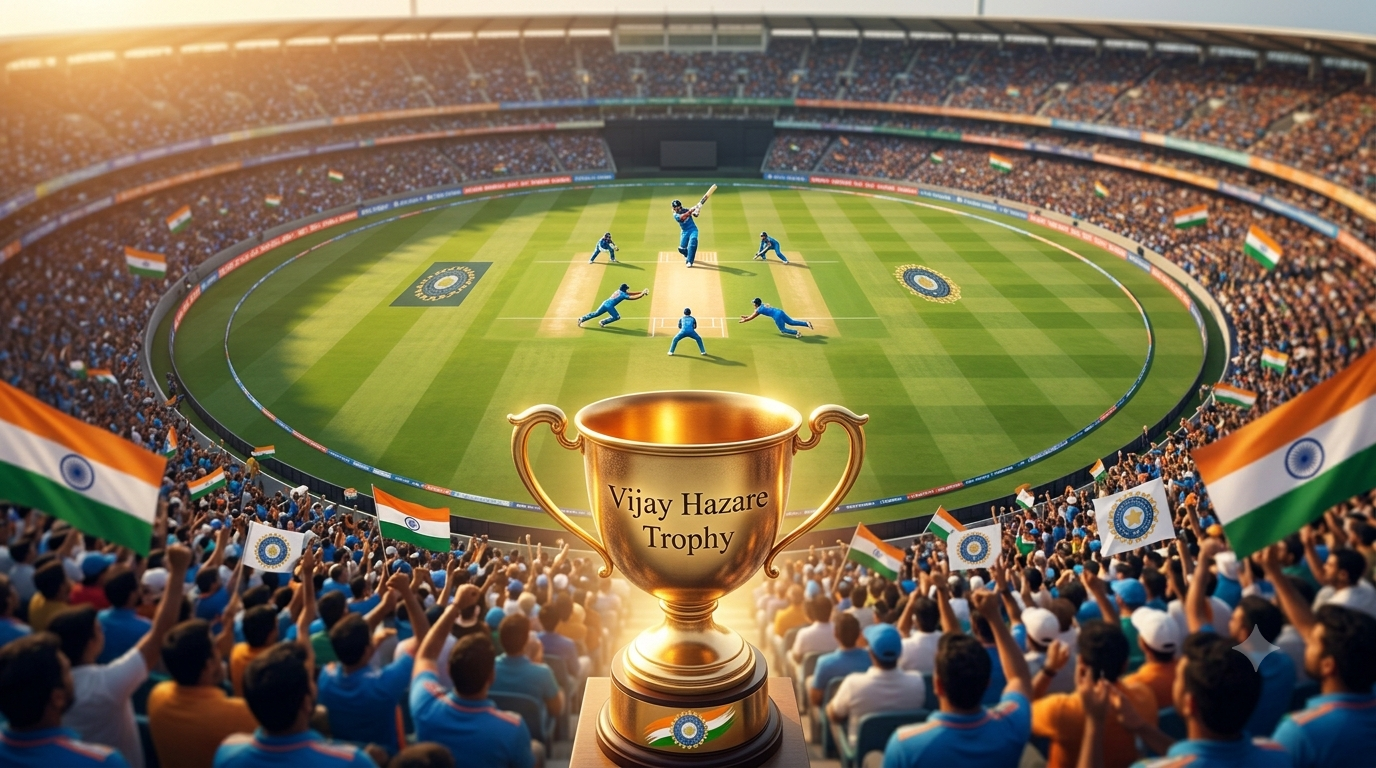
| Champion | Vidarbha (1st domestic title) |
| Runner-Up | Saurashtra |
| Tournament Dates | 24 December 2025 – 18 January 2026 |
| Final Venue | Bengaluru, Karnataka |
| Final Match Margin | Vidarbha beat Saurashtra by 38 runs |
| Final Player of the Match | Atharva Taide (Vidarbha) – Scored a decisive 128 runs |
| Player of the Tournament | Aman Mokhade (Vidarbha) |
Aman Mokhade finished as the leading run-scorer of the competition, matching the record for the quickest 1,000 runs in List A cricket during his stellar campaign. [1, 2]
| Player | Team | Matches | Innings | Total Runs | Average | Strike Rate | 4s / 6s |
| Aman Mokhade | Vidarbha | 10 | 10 | 814 | 90.44 | 109.26 | 86 / 17 |
| Devdutt Padikkal | Karnataka | 9 | 9 | 725 | 90.62 | 98.24 | 71 / 21 |
| Harvik Desai | Saurashtra | 10 | 10 | 581 | 64.56 | 91.07 | 68 / 11 |
| Pukhraj Mann | Punjab | 7 | 6 | 558 | 93.00 | 107.31 | 52 / 13 |
| Dhruv Jurel | Uttar Pradesh | 7 | 7 | 558 | 93.00 | 122.91 | 53 / 18 |
Top 5 Bowling Statistics (Most Wickets)
Saurashtra fast bowler Ankur Panwar led the charts as the highest wicket-taker of the season, registering a best performance of 5/27.
| Player | Team | Matches | Innings | Wickets | Average | Economy Rate | Strike Rate |
| Ankur Panwar | Saurashtra | 10 | 10 | 25 | 21.32 | 5.86 | 21.80 |
| Satyanarayana Raju | Andhra Pradesh | 7 | 7 | 21 | 16.00 | 4.80 | 20.00 |
| Zeeshan Ansari | Uttar Pradesh | 8 | 8 | 21 | 16.52 | 4.95 | 20.02 |
| Mustafizur Rahman | Bengal | 7 | 7 | 18 | 19.50 | 5.10 | 22.90 |
| Darshan Nalkande | Vidarbha | 9 | 9 | 17 | 22.10 | 5.35 | 24.78 |
| Metric Category | Player | Team | Notable Statistic |
| Highest Individual Score | Vishvaraj Jadeja | Saurashtra | 165* against Karnataka in the semi-final |
| Best Batting Strike Rate | Vaibhav Sooryavanshi | Bihar | 235.10 (Innings: 2, Average: 110.50) |
| Best Bowling Economy | Varun Chakravarthy | Tamil Nadu | 2.72 across 2 matches |
| Best Seam Economy | Shardul Thakur | Mumbai | 3.41 across 5 matches |
The elite teams were divided into groups to determine the knockout spots. Here is the final state of the top teams within the key groups during the initial league stage. [1]
| Group | Team | Matches | Won | Lost | Points | Net Run Rate (NRR) | Knockout Status |
| Group A | Vidarbha | 7 | 6 | 1 | 24 | +1.432 | Advanced to Quarter-Finals |
| Group A | Saurashtra | 7 | 5 | 2 | 20 | +0.985 | Advanced to Quarter-Finals |
| Group B | Karnataka | 7 | 6 | 1 | 24 | +1.115 | Advanced to Quarter-Finals |
| Group B | Tamil Nadu | 7 | 4 | 3 | 16 | +0.450 | Eliminated |
| Group C | Uttar Pradesh | 7 | 5 | 2 | 20 | +0.812 | Advanced to Quarter-Finals |
| Group C | Andhra Pradesh | 7 | 5 | 2 | 20 | +0.621 | Advanced to Quarter-Finals |
| Group D | Mumbai | 7 | 4 | 3 | 16 | +0.231 | Eliminated |
Attacking batting lineups took advantage of friendly batting conditions, leading to several massive 350-plus totals across the tournament.
| Rank | Batting Team | Opponent | Total Score | Overs | Venue |
| 1 | Uttar Pradesh | Bihar | 412 / 4 | 50.0 | Alur |
| 2 | Saurashtra | Karnataka | 387 / 5 | 50.0 | Bengaluru |
| 3 | Karnataka | Tamil Nadu | 368 / 6 | 50.0 | Bengaluru |
| 4 | Vidarbha | Tripura | 354 / 3 | 50.0 | Alur |
| 5 | Punjab | Goa | 349 / 7 | 50.0 | Ahmedabad |
Consistency at the top of the order allowed several premier batsmen to convert their starts into multiple three-figure scores during the campaign.
| Player | Team | Matches | Innings | 50s | 100s | Highest Score |
| Aman Mokhade | Vidarbha | 10 | 10 | 3 | 4 | 134 |
| Devdutt Padikkal | Karnataka | 9 | 9 | 2 | 3 | 142 |
| Pukhraj Mann | Punjab | 7 | 6 | 2 | 2 | 126* |
| Dhruv Jurel | Uttar Pradesh | 7 | 7 | 3 | 2 | 118 |
| Atharva Taide | Vidarbha | 10 | 10 | 2 | 2 | 128 |
This table measures the efficiency of batsmen in finding the ropes, calculated by their overall strike rate and total boundary count (minimum 150 runs scored in the tournament).
| Player | Team | Total Runs | Fours | Sixes | Boundary Percentage | Season Strike Rate |
| Vaibhav Sooryavanshi | Bihar | 221 | 24 | 9 | 67.8% | 235.10 |
| Dhruv Jurel | Uttar Pradesh | 558 | 53 | 18 | 57.3% | 122.91 |
| Aman Mokhade | Vidarbha | 814 | 86 | 17 | 54.7% | 109.26 |
| Pukhraj Mann | Punjab | 558 | 52 | 13 | 51.2% | 107.31 |
| Devdutt Padikkal | Karnataka | 725 | 71 | 21 | 56.5% | 98.24 |
| READ ALSO: Sa20 stats |